
This is the second of three posts about the wildlife tracking work we did at DA-IICT between 2006 and 2013, in collaboration with the Wildlife Institute of India, Dehradun. In the first part I described how a fusion physicist came to be working on wireless sensor networks at all, how a lecture on the Zebranet project led to a visit to WII, and how one question asked in a room full of wildlife scientists produced twelve project ideas of which three were taken up. It also covered the first hand-wired prototype and the months we spent testing it on the bed of the Sabarmati river.
The three projects were deliberately chosen not to overlap: a GPS based collar for medium to large animals, aimed finally at the Barasingha (Swamp Deer); an image sensor network to photograph tigers along their trails; and a way of tracking small hill turtles inside the WII campus, where a GPS receiver could not be used at all. We called them wildCENSE, tigerCENSE and turtleCENSE. This part is about what each of them turned out to demand.
wildCENSE: a collar that carries its own post office
The standard way to track a large animal is a satellite collar. It works, but it is expensive both to buy and to operate, and that cost decides everything else – if a collar costs a fortune, a researcher can put it on three animals, not thirty, and three animals do not tell you much about a herd.
So we decided to avoid satellite communication altogether. Each collar would take a GPS fix every three hours, store it in flash memory along with sensor readings, and wait. When two collared animals came within radio range of each other, they would exchange whatever data they were carrying. Sooner or later one of those animals would pass a base station, and the entire herd’s history would be handed over in one go. The animals themselves became the data carriers. This is the idea Zebranet had demonstrated, but we added things that mattered to Indian researchers – micro-climate around the animal (temperature, humidity, ambient light) and neck orientation through an accelerometer, so that one could tell whether the animal was grazing, walking or resting – and we did not restrict the movement path in any way.

The node was built around an ATMega1281V micro-controller with a Lassen iQ GPS receiver, an XBee-Pro 2.4 GHz transceiver, a DS3231 real time clock, AT45DB16B data flash, a Sensirion SHT11 temperature and humidity sensor, a TAOS TSL2561 light sensor and a Freescale MMA6270QT accelerometer, all running on a common 3.3 V supply from a Li-ion battery with provision for solar recharging. The board itself was 5 x 6 cm and weighed 34 grams; the complete system excluding the collar came to under 300 grams. On paper the node needed about 13.5 mAh per day, so an 8 Ah pack would keep it alive for a year, with solar charging extending it further.

Paper is one thing. In August 2008 we put the first collar on a cow. We used a domestic animal deliberately – at that stage we were testing our own device, and we needed to be able to walk up to it, take it off, and check whether the data it recorded matched what we had observed with our own eyes. You cannot do that with a Barasingha.
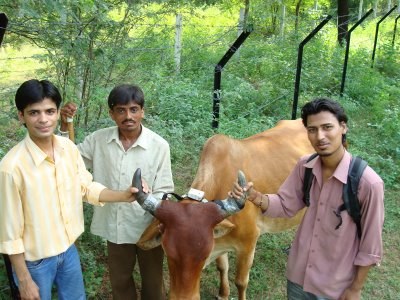
That first trial (22 August 2008) taught us more than any laboratory test had. The battery drained far faster than our calculations said it should, because the sleep mode was not actually being entered. The belt we had made was loose, so the node kept sliding around the neck; the neck-orientation data became meaningless and the GPS antenna spent much of its time pointing at the ground instead of the sky, which lengthened the time to get a fix. The micro-climate sensors were mounted at one end of the node, and with the node sliding sideways they ended up sensing the cow’s body rather than the environment.
We redesigned the harness: battery pack hung at the lower end, node at the top, and a provision to tie the node to the horns so that it stayed fixed in the animal’s own frame of reference. The second trial ran from 2 to 4 September 2008 – 46 hours with no human intervention at all, a reading every three minutes and a radio contact attempt every thirty minutes. The GPS readings were within 15 metres, well inside the 50 metre tolerance the researchers had asked for. Temperatures logged between 30 and 45 degrees, exactly as one would expect in Gujarat in September. When we plotted the 24-hour track of 3 September on a satellite map with each point carrying its temperature, humidity, light and neck orientation, it was, for me, the first moment the whole thing stopped being an idea and became an instrument.


We later rebuilt the same functionality on a board about two-thirds the size of a credit card, and then again with a faster GPS module. The plan from there was to move up in stages – first Spotted Deer (Cheetal) at Sariska, since the Barasingha is on the endangered list and permission to instrument one is rare and not to be wasted on a device that has not yet proved itself, and only then Barasingha in Uttarakhand. If I had to state the single lesson from wildCENSE it would be this: the electronics was the easy part. The belt was the hard part. Anything that goes on the body of a living animal is a mechanical design problem wearing an electronics disguise.
tigerCENSE: rebuilding the camera trap
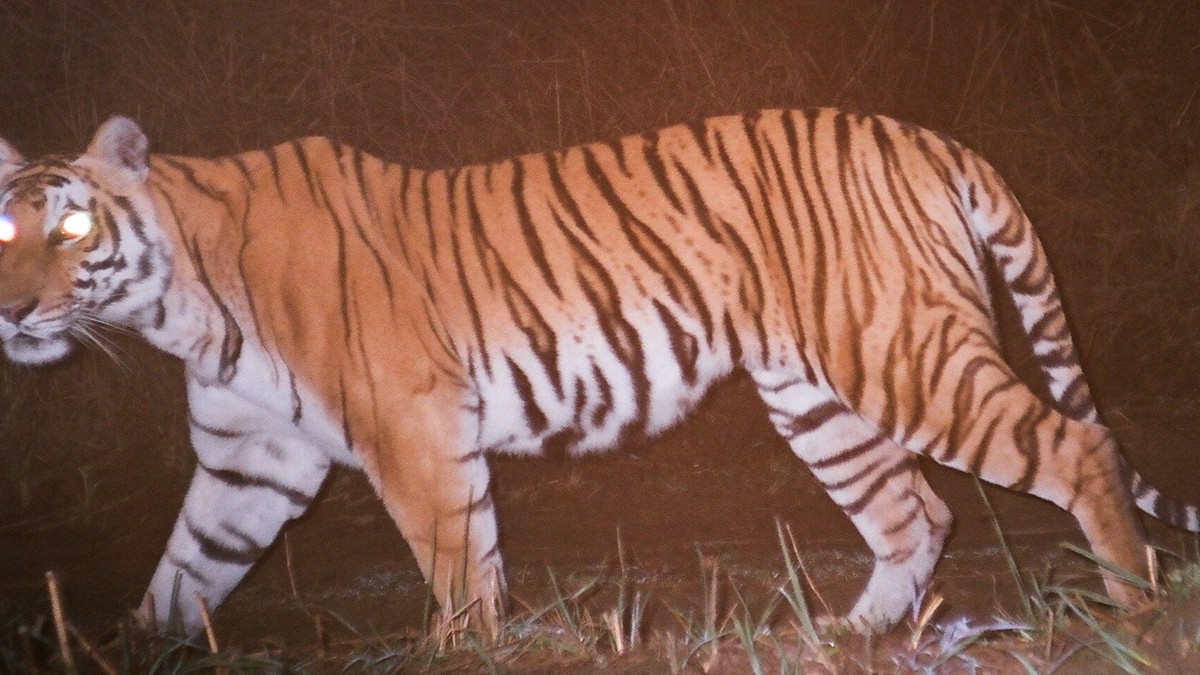
A tiger’s stripes are as individual as a human fingerprint, and no two tigers carry the same pattern, nor does one side of a tiger match its other side. That single fact is what makes camera traps central to tiger census work – a photograph is not just evidence that a tiger passed by, it tells you which tiger passed by.

The traps in use at the time were an assembly of off-the-shelf parts: a commercial camera, a motion detector, wires, a big battery, a box. They were bulky and easy to spot, and therefore easy to steal. The shutter clicked and the flash was white, both of which announce to a wild animal that something unnatural is standing beside its trail. The delay between the sensor triggering and the picture being taken ran into seconds, so fast-moving animals were simply missed. And, most frustrating for the researcher, the trap had no way of telling anyone it was alive. The film could have run out, the battery could have died, the unit could have been carried away weeks ago, and nobody would know until somebody walked back to that spot.


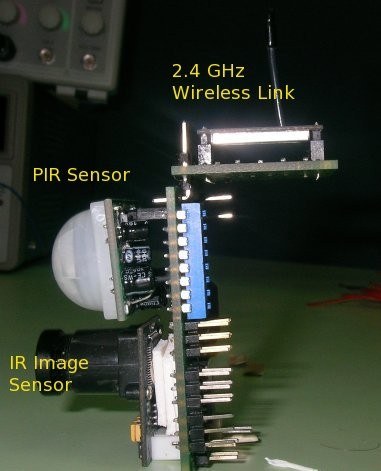
We designed a single integrated node instead. A Parallax PIR sensor watched the trail. When it triggered, the micro-controller woke up, powered the camera – a COMedia C328R module with a lens deliberately chosen without an IR cut filter – read the ambient light through a photo-resistor and, if it was dark, fired an infrared flash. The image was time-stamped and written to a micro-SD card, and transmitted over the radio link when a link was available. There was no shutter sound and no visible light. The populated board was 3.8 x 5.6 x 3.1 cm and weighed 43 grams.

The infrared flash was the interesting engineering problem. To get usable illumination we needed a very large current for a very short pulse – about three amperes for a few tens of milliseconds – which a battery will not supply directly. We used super-capacitors as a charge buffer and a power MOSFET with very low ON resistance to switch twelve high-intensity 850 nm LEDs. But how long should the flash stay on? Too short and the stripes do not register; too long and the moving animal blurs.
We answered that question at Kankaria Zoo in Ahmedabad. With permission from Mr. R. K. Sahu and his colleagues, we set our prototype box near a tiger enclosure and programmed it to take pictures with flash ON times increasing from 10 ms to 70 ms in steps of 10 ms. Thirty milliseconds turned out to be enough to bring out the stripes clearly. For comparison, some commercial digital cameras use a flash time of 125 ms, which blurs a moving animal to the point of uselessness. The minimum achievable delay between the PIR interrupt and the photograph came down to 250 ms, against several seconds for the traps then in use; in practice we set a deliberate 1.8 second delay so that the animal would be in the middle of the frame by the time the picture was taken.


The node went through a further generation after that. Ambuj Varshney rebuilt it around the Atmel Atmega128RFA1, which puts the micro-controller and the radio on one chip, running ContikiOS with 6LoWPAN and RPL routing. That gave us proper multi-hop networking – the earlier version could only talk to a base station directly – and IPv6 addressing, which meant a node in a forest and a base station anywhere in the world were, in principle, just two addresses on the same network. On the energy budget we worked out, the whole node could run for about 140 days on a single pencil cell.
The field trial we were preparing for was at Ranthambore National Park. The design was for a mobile base station to collect from the nodes, a MySQL database behind it, and each image carrying its time and location embedded in the EXIF header so that no separate bookkeeping was needed to know which picture came from where. Nodes would also alert their neighbours when something passed, so that an animal walking a trail would be met by cameras that were already awake.
turtleCENSE: the problem that beat us
The Tricarinate hill turtles in the WII campus weigh less than 500 grams. The rule of thumb for wildlife instrumentation gave us a device budget of 25 grams. A GPS receiver and the battery needed to run it will not fit inside 25 grams, and no amount of clever engineering was going to change that. So this project began from a hard constraint: locate an animal without letting the animal do any of the locating.

Traditionally these turtles were studied by painting an identification mark on the shell and noting down where it was found. If the same turtle was found again, one had another data point. Between two sightings, which could be months apart, one knew nothing at all.
Our approach inverted the usual arrangement. The turtle carried a very light node – an ATMega32, an XBee transceiver with chip antenna, an SHT-11 temperature and humidity sensor, an accelerometer, a solar film and a small battery – and its only job was to send out a short beacon from time to time. All the intelligence sat in a grid of fixed anchor nodes around the campus, mounted on the street light poles, which meant they had mains power and no energy constraint whatsoever. Each anchor recorded the signal strength (RSSI) of the beacon it heard and passed it on to a base station.
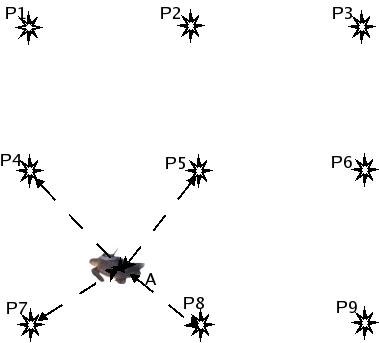
Signal strength is a notoriously unreliable way to measure distance, so we did not try to convert it into one. We used a statistical, range-free method called the Incremental Grid Based Approach: the area between the anchors is divided into cells, rings of possible distance are drawn from each anchor based on a calibration taken beforehand along the sides of the grid, a count is incremented for every cell a ring passes through, and the centroid of the cells with the highest count is taken as the animal’s position. The accelerometer had a second purpose here – during hibernation there is no movement at all, so the node could stop transmitting and save its battery, and the researcher would still learn exactly when hibernation began and ended, and in what micro-climate.
In our own campus this worked reasonably well. With three receiving stations forming a triangle 55 to 70 metres on a side we got errors between 3 and 10 metres. With four anchors around a 60 x 60 metre cell the mean error was 3.2 metres in x and 4.3 metres in y. For an animal that moves a few metres in a day, that is entirely adequate – and it was roughly the accuracy of a GPS-based system, at a small fraction of the power on the animal’s body.

And then the environment intervened. We ran the same calibration in open ground and in an area with dense foliage, before sunrise and after sunset, and got materially different signal strengths. Vegetation, humidity, temperature – all of them shifted the calibration matrix, and a shifted calibration matrix shifts the estimated position of the turtle. We understood the problem clearly enough. What we needed was an algorithm that would recalibrate itself continuously from the anchors’ own cross-traffic. We tried several ideas and none of them worked well enough to deploy. Of the three projects, this is the one I have to record as unfinished. I will say, though, that a problem of this shape – a noisy measurement with a slowly drifting environmental bias, and plenty of reference nodes to learn from – is far more tractable with today’s machine learning tools than it was with what we had in 2010, and I would encourage anyone looking for a project to pick it up.
The piece that served all three: seeing the data
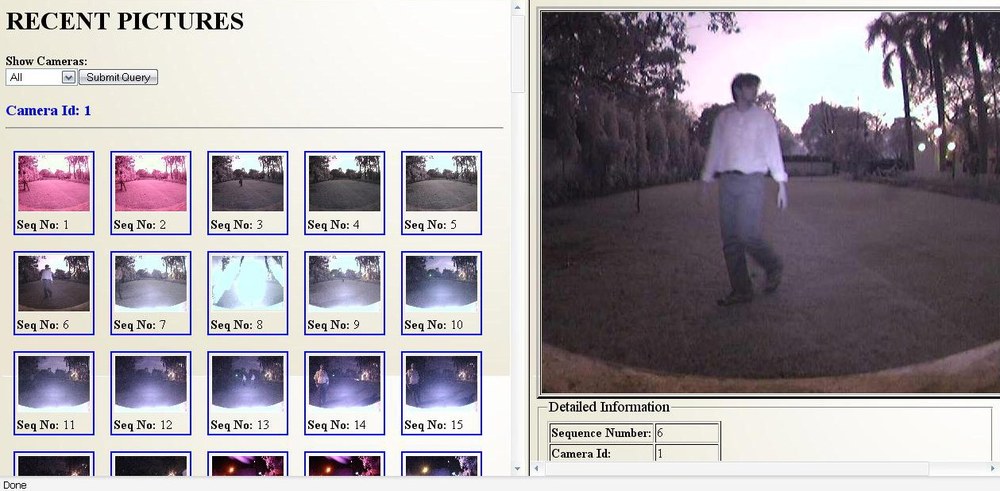
One decision made early on paid for itself many times over. Instead of building a separate data path for each project, we split the problem in two: field devices push their data over a wireless link into a database server with an Internet connection, and a browser-based application reads from that database and plots it. Because the second half knew nothing about which project the data came from, the same software displayed a collar’s track on a satellite map, a turtle’s estimated position inside the anchor grid, and a gallery of camera images sorted by location and time.
This was not glamorous work, and it was done almost entirely by undergraduates – Aatish Motwani and Sandeep Das wrote it, along with the requirements, design, test cases and user manual, in the proper style of a software project. But when a wildlife researcher sits down in front of your system, this is the only part they see. The 6LoWPAN stack does not exist for them. A track on a map, with a click showing that at 08:13 on 3 September the temperature was 32 degrees and the animal’s neck was tilted, does.
The students who built it
None of this was built by me. It was built, over six years, by successive batches of students who took one piece of the problem each, worked on it for a semester or a year, and handed it to whoever came next. The papers carry a few of their names; the project reports carry many more. Since this is the part that usually disappears from an account like this one, let me set it down.
wildCENSE, the GPS collar: Ravi Bagree and Vishwas Raj Jain built the node, with Aman Kumar; Prabhat Saraswat and Obulpathi Naidu had done the groundwork in the versions before it. Manish Jain ported FreeRTOS to the node, Akshat Logar rebuilt it on the Atmel ZigBit with the BitCloud stack, Radhakrishna Sripada and Sai Dheeraj Polagani took on the sensor node design, and Aditya Lodha worked on quality of service.
tigerCENSE, the image sensor node: Amrit Kumar Panda and Rigveda Kadam started it as camera-trap work in 2007, and Dheeraj Kota and Hemant Kavadia carried it forward the following year. Ravi Bagree, Vishwas Raj Jain and Aman Kumar built the version that went to Kankaria Zoo. Bhargav U. L. N. worked on image communication efficiency and data rate, Gorthi Chandu Sridhar on the infrared LED flash, Ambuj Varshney on the Atmel ZigBit and later Atmega128RFA1 designs, Siddharth Kothari on the multi-hop protocol, and Gowri Sundaram, Palak Shah and Rini Joshi on the flash driver. Shubham Jain, then a doctoral student, helped at many points along the way.
turtleCENSE, the GPS-less system: Swetha Narumanchi, V. Pavan Kumar and C. Obulapathi Nayudu did the first work on localisation and the field measurements behind it. Apurva Joshi, Naga VishnuKanth I, Navkar Samdaria and Sumit Bagla built and tested the grid system. Kunal Shah and K. Wasif, Ch. Phani Kanth and Prateek Sheel, and later Sri Harsha R. Koundinya and Ajay Anaparthi each took the small-animal tracking problem a stage further.
And the visualization software that all three depended on was written by Aatish Motwani and Sandeep Das, along with its requirements, design document, test cases and user manual.
Several of them have gone on to do serious work in sensor networks and related fields elsewhere in the world. If I have left anyone out, or spelt a name wrongly, write to me and I will correct it.
So much for the three projects we had agreed on. What we did not expect was how quickly the same ideas started pulling us towards animals, and places, that had nothing to do with the original list – a frog that spends fifty weeks of the year underground, and a coral reef in two oceans. That, along with what the whole exercise taught me, is the subject of the last part.