
Technology Vision 2035 was launched by the Prime Minister on the morning of 3 January 2016. We are now closer to 2035 than to that morning. Ten years and seven months of the twenty are gone.
I have written before that studying the impact of TV 2035 has to be a continuous process, and that mid-course correction matters more than the launch did. This series is that audit, done in public, against our own numbers. Over five parts I want to look at the scorecard as a whole, then at health, then at the resource prerogatives, then at the technology we filed under "future" and got wrong, and finally at what I would hand to whoever runs the next exercise.
A word on why this can be done at all. Most vision documents are written so that they cannot be graded. Ours was not. The vision document named twelve prerogatives — entitlements of every Indian, six individual and six collective, running from clean air and potable water to eco-friendly conservation of natural resources — ten Grand Challenges, and hard figures with a date attached. Alongside it came the Technoscape, a snapshot of twelve sectoral roadmaps, and those roadmaps carried something more useful still: their own baselines. When a document states both where it thinks the country stands and where it wants the country to be, it has handed you the instrument for marking it.
The gaits, turned on ourselves
When we looked back at Technology Vision 2020, we borrowed the gaits of a horse — galloping, cantering, trotting, walking — to describe how different sectors had moved. It seems only fair to apply the same instrument to our own document.
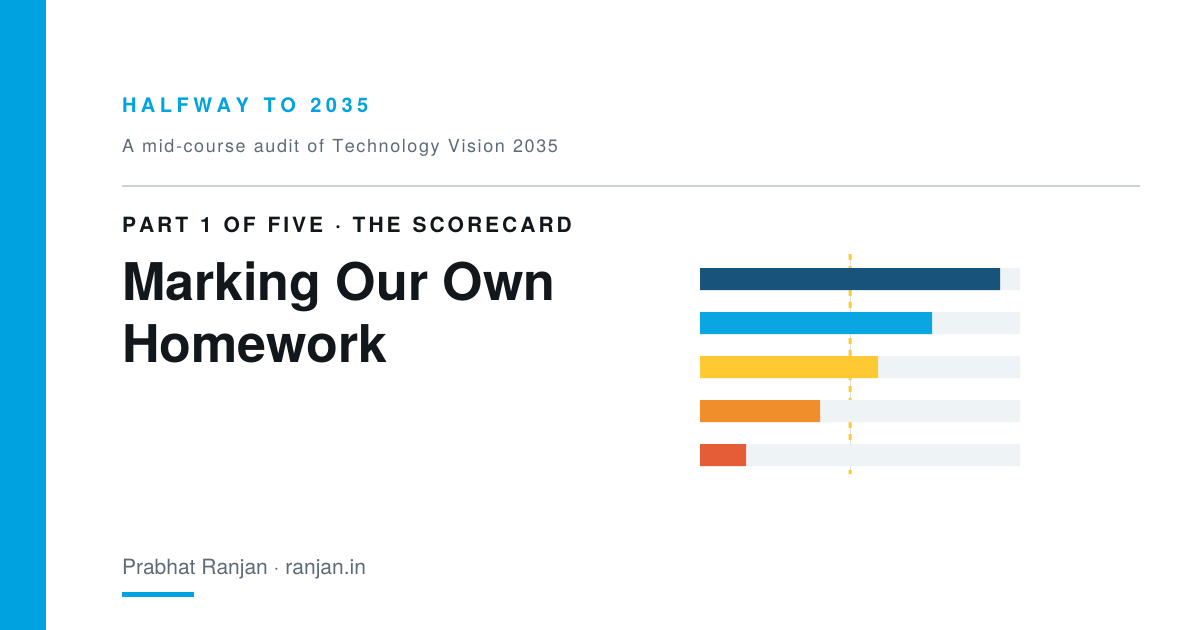
Two honest additions to the method. First, I have plotted progress towards each 2035 target against the share of the clock that has run. Counting from the launch to the end of 2035, that is 53 per cent. Anything below that line is behind, however good the press release sounds. Second, four gaits were not enough. Three indicators are further from their target today than when we published, so I have added a fifth band: reversing.
Wherever a roadmap states its own baseline, I have used it rather than a figure of my own choosing. This matters more than it sounds. The medical sciences roadmap put maternal mortality at 190 per 100,000 in 2013; the Sample Registration System put it at 167 for 2011-13. Measured from our own starting line, the country has covered 59 per cent of the distance to the target. Measured from the official series, less. I have used our number, which flatters us, and I would rather say so than quietly take the better score.
What the bands say
Galloping is not energy, as I had assumed before going back to the numbers, but livestock. Milk, per capita milk availability and egg production have all passed their 2035 figures already. Part three deals with what that means.
Cantering — at or ahead of the clock — covers rural drinking water, which went from about 17 per cent of households in 2019 to just over 82 per cent by July 2026, and maternal mortality, which is ahead of the clock on our own baseline while having stalled in absolute terms. Part two is about that contradiction.
Trotting holds out-of-pocket health spending, under-five mortality and power distribution losses — all moving in the right direction, all set to miss. Foodgrain production sits just at the pace line, which is roughly what a well-set target should look like at the halfway point.
Walking holds literacy at 80.9 per cent against a target of 100, forest cover, and the share of electricity actually generated from non-fossil sources.
Reversing holds anaemia among women of reproductive age, which rose from 53 to 57 per cent between the last two National Family Health Surveys and was the subject of our first Grand Challenge; gross expenditure on R&D, near 0.64 per cent of GDP against the two per cent the Call to Action assumed; and total health spending, which the roadmap projected would rise from 4.0 per cent of GDP to 5.7 by 2035 and which stood at 3.37 per cent in 2022-23.
The pattern underneath
Reading the scorecard sideways rather than down, one thing recurs.
Where the target is something the state can build, procure or count — tap connections, installed capacity, foodgrain tonnage, road length — we are at or ahead of pace. Where the target is an outcome that requires a system to work properly for a particular person on a particular day — a safe delivery, a functioning tap, a child who can read — we are behind, and the deceleration is worst in exactly those places.
That is not a new finding. It is the lesson we ourselves drew from TV 2020, when we wrote that India had made quantitative leaps without the concomitant qualitative improvement. A decade on, our own document is producing fresh examples of it. I take that as the central result of this audit, and the rest of this series is an attempt to say why it happens and what a successor exercise might do about it.
Next: the sector that stopped moving.
Prabhat Ranjan was Executive Director of TIFAC through the preparation and launch of Technology Vision 2035.
Targets as stated in Technology Vision 2035 and the Technoscape roadmap summaries (TIFAC, 2015). Current figures: Sample Registration System; National Health Accounts 2022-23; Basic Animal Husbandry Statistics 2025; CEA and MNRE; Power Finance Corporation; Ministry of Jal Shakti; PLFS 2023-24; India State of Forest Report; NFHS-4 and NFHS-5; Economic Survey 2025-26.